In the last issue of the Global Farmer I discussed the need for change based on a strategic plan for the behemoth called Australian agriculture. It is not possible to look at the whole until the parts have been examined.
To start with the wheat industry is logical and relevant considering this is the time of year to review last year and make plans for and give a commitment to the next season and beyond.
The headline says it all, based on current trends, the wheat industry in Australia will be gone in twenty three years. If you are having difficulty in trying to remember what was going on in Australian agriculture twenty three years ago, it was five years after the wool price crash and we were all being told to get rid of our world beating merino sheep. That is how close we are to the demise of the Australian wheat industry. It won’t happen like the wool crash, for those who refuse to recognise the signs it will be a slow, painful and imposed exit.
We plan for the future.
For the sound strategic thinkers their plans go well beyond next year and the next crop. They have a five or a ten year plan because growing wheat is a long term and expensive business, debts incurred this year for the purchase or new machinery, more land, lime, whatever, are all investments in the future, so the investor, the grower, has to be confident that the investment is sound and if money is borrowed for that investment, then they have to be confident that the debt can be repaid as and when it falls due. It takes considerable courage to commit to a five or even a ten year strategic plan for any business and wheat farming is no exception. Failure to commit results in disappointment and sometimes failure of the business. This is not the time or the forum to detail what should be in a strategic plan, suffice to say there is no substitution in any business for honest goal setting, honest analysis of the business, formulation of the strategy, implementation of that strategy and finally evaluation and control.
Over the years hundreds of millions of dollars has been spent on wheat breeding in Australia. Much of that expenditure has been paid for by wheat growers from the levy that all wheat growers pay on every tonne of wheat they produce. The levy goes to the Grains Research and Development Corporation, who are now shareholders, with others, in another organisation dedicated to improving wheat yields in Australia. Ross Kingwell in a blog from the Australian Export Grains Innovation Centre explains it this way: 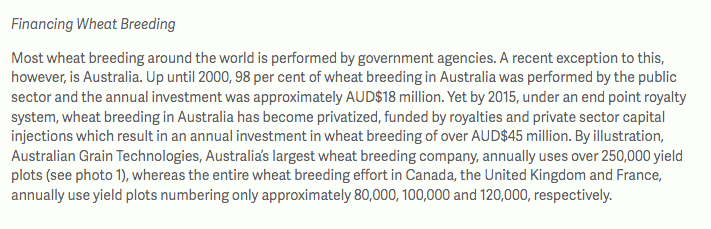
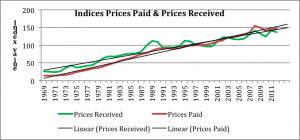
Fig 1. In spite of that considerable annual investment the records show that wheat yields in Australia have shown no significant increase in yield since 1990 and are now in decline. The same cannot be said for the rest of the world although France (green line) shows a slight decline on this graph which is not borne out on the ‘Our World Data’ site. What Fig 1 and 2 do show is that Australia is not increasing wheat yield and the majority of the rest of the world is increasing yield.
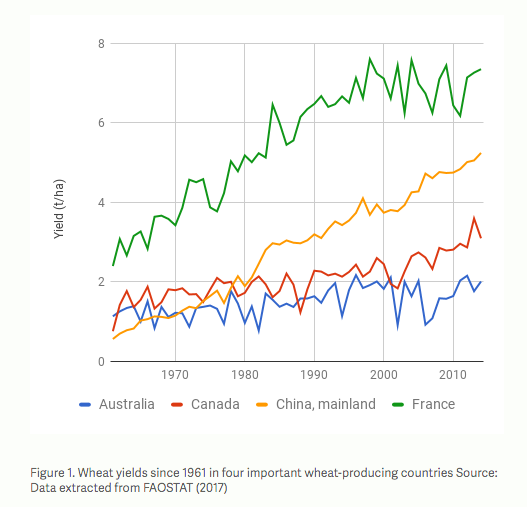
These statistics on wheat yields from around the world are from ‘Our World Data’ a quite extraordinary interactive site developed by an economist from Oxford University in the United Kingdom. It’s one of those sites that can settle a disagreement on where world agriculture is going and where it has been. Just to make my point about the failure of Australia to keep up with the rest of the world on improving wheat yields, this is what has happened to wheat yields between 1961 and 2014 in some of the main wheat growing countries, all in tonnes per hectare plus a percentage increase. USA 1.68 to 2.94 = 75%; UK 4.3 to 8.6=100%; Russia .99 to 2.01=152%; Brazil .53 to 2.75=418%; India .89 to 3.15=253%, in Australia the gain has been from 1.13 to 2.01=78%. Ukraine .99 to 4.01=304%; Belaraus .99 to 3.9=303%; Romania 1.33 to 3.6=170% and so it goes on. The data on this site gives a wheat yield per hectare in Australia 20 years ago at 2.01 tonnes, the same as today, ABARE and others put it a bit lower at 1.8 tonnes.
The treadmill.
If you have been on the financial treadmill of agriculture since about 1990, you are probably extraordinarily fit and good at financial gymnastics, but the scenery has been depressingly constant.
When a farm has been in the same family for generations and generated enough money to clear the land, send the next generation away to school, maybe buy an investment property and/or a property for the retiring generation or put money away in Farm Management Deposits, it can be challenging to say the least to find that those funds are no longer generated out of what was the family farm. As families have grown, because generations now lived longer, so it has become incumbent on the farm business to provide for the many who, if you like, invested their superannuation in the farm business and who called on that investment in their retirement years. As a consequence many farming families decided that the only way they could meet the needs of those dependent on them was to get bigger, buy more land. So substantial investments were made in land and in bigger machinery in an attempt to re-establish the good old days and to make enough money to pay for the extended family budget in the same way as previous generations had provided. What the majority didn’t realise was that even though they were asset rich, because of the increase in the book value of their current land, was that what they were receiving and what they were paying was the same or for many as the national rural debt shows, they were receiving less than they were paying.
When all else fails – buy another farm?
The answer to that proposition has to be caveat emptor, ‘let the buyer beware’—here’s why.
In 1970 there were about 14000 farms in the wheat belt of Western Australia, today there are less than 5000, a decrease of over 60%. The participants in the agricultural industry, from federal, state and local governments, service industries, infrastructure providers, bankers, consultants and farmers have all watched this evolution and not given it a great deal of thought. Communities accepted that as neighbour or neighbours bought out neighbour, farms would get bigger and fewer people would live in the district. On closer examination there were other drivers in the market place other than Henry Schapper’s now famous ‘Get big or get out’. Hindsight would now say better advice would have been ‘Get big and then get out’, as we shall see.
In the seventies, when there was a short but good mini commodity boom in both wool and wheat, some 350 farms per year were sold to neighbours. Farmers from the eastern states, especially South Australia and to an influx of farmers from the UK, and investors from all over the world, were attracted by what they saw as cheap land with low costs. In the 80s farm sales dropped to 181 per year. This was one of the decades of farm aggregation when many were encouraging the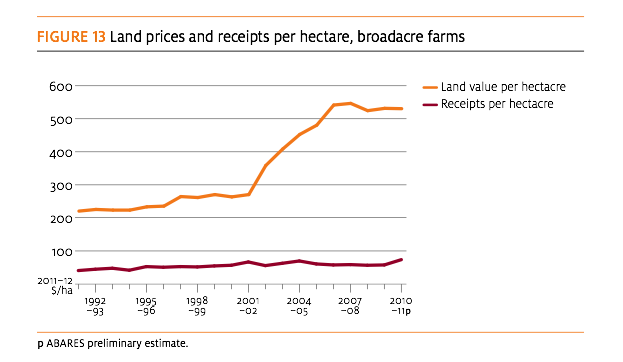 ir children, the future farmers, to get a tertiary education or a trade before returning to the farm, ‘just in case farming got worse’. Many young people followed that advice and decided not to return to the family farm when they had completed their studies or training. So a substantial part of the next generation of farmers decided against farming. There were some tough times in the eighties, but on the positive side wheat yields were continuing to increase year on year as was wool prices were improving but heading for the 1990/1 crash. Farm machinery was getting bigger, direct drilling, putting a crop in with one spray and a seeding operation was enjoying massive adoption and so the productivity per operator was increasing markedly. Crops were sown over a shorter period with fewer people.
In the 1990s farm numbers decreased by just under 100 per year, and in the first decade of this century, 2000 to 2010, farm sales shot up again to just under 200 farms per year. What I can’t reconcile is that in the 10 years or so between 1992 and 2002 (Fig13) land values increased by about fifty dollars a hectare to under three hundred dollars a hectare. Then between 2002 and 2007/8, in seven or eight years they jumped to over five hundred dollars a hectare, while amazingly receipts per hectare almost flatlined. Around 1990 wheat yields also stopped increasing and started declining. So what was the reason for the rush to buy land? Figure 13 shows the trends Australia wide. For a detailed discussion on what happened to land prices in WA, I discussed this in the Global Farmer in 2014. The figures still surprise me because the increase in land values in WA was greater than the national average.
Was buying more land a smart move?

The short answer is no. The long answer is probably not. In that article from just three years ago, there is a detailed discussion on the prices paid for land in the wheat belt of Western Australia, and there is no denying that the ever-increasing prices were not tied to and increase in yield or, more importantly, to profit. Farmers usually don’t make decisions in isolation, many have farm consultants and many have wives and partners and many have both. The final decision to buy depends on the lender, usually the bank. Given that there were potentially another two or three brains in the decision to buy more land, why were those advising on land purchase and those lending the money not aware of the information in Graph 2? Was it a matter of keeping up with the Jones’s? Look at Chart 1 and look at the increase in debt levels, farmers borrowed and banks lent money based on the increase in land values, an increase that cannot be rationally explained, it certainly wasn’t due to an increase in profitability. The only party with any security in those transactions was, as we all know, the bank.
Fewer farms has meant bigger farms. That begs the question whether that has been a good thing or bad? Ben Rees, farmer, researcher and rural economist, has provided some vital information to guide rural Australia into the future. The graphs are a few years old but you will get the picture and nothing has really changed in the intervening years. It is quite alarming that the dollar output supported by debt has declined as the number of farms has declined. These numbers are for all ‘establishments’ including grain farmers. It raises the serious question regarding the ability of farmers as managers to maintain the level of production they achieved on a smaller property when they move to a bigger property. Graph 2 shows that economies of scale for all farms do not apply, that is the dollar output supported by debt declines at a greater rate than the decline in farm numbers. Does it also show that you can’t borrow you way out of trouble with bigger machinery?
For a full explanation of Chart 1, go to Ben’s web site and to this article. To my non economists brain what Chart 1 shows is that the increase in rural debt fits perfectly with the decrease in the number of all farms, not just those growing wheat. When looking at the gross and the net value of farm production and the debt, it is a matter for individual judgment whether the wheat belt is on a sound footing. I agree with Ben that if profitability and productivity were tied together then the lines would be closer together and they are not. Governments and all politicians, and all rural commentators please note, just because gross value is up it does not mean all is well on the land. The latest debt figures available from the Reserve Bank of Australia, show rural debt at the time of writing, that is for 2017 is $71.5 billion, an increase of two billion on 2016. That means that in the last five years Rural Debt has grown from $63.5 billion to $71.5 billion and the last annual increase maintains the trend.
 So where does that leave the Australian wheat industry?
An opinion from CSIRO — we are heading for a national average of just 1.55 tonnes per hectare by 2041.
A recent article in ‘The Conversation’ predicts that even if wheat farmers get a lot closer to the ‘potential yield’ than they are today, by 2041 the national average yield will be 1.55 tonnes per hectare, down from where they say it is at present at 1.74 tonnes per hectare.
Yields will never get that low, given that nothing dramatic and unexpected happens like new high yielding drought tolerant wheat varieties, the wheat industry as we know it will be finished long before we get to 1.55 tonnes per hectare, that’s back to the yield of the 70s with the costs of 2041.
The three scientists who make those predictions on yield decline are Zvi Hochman, David L Gobbett and Heidi Horan and they are contained in a recently published article in ‘The Conversation’. It is a comprehensive yet short paper titled ‘Changing climate has stalled Australian wheat yields: study
I recommend the reading of the full article and that you make up your own mind regarding the assumptions made by the authors when they look at the future. Firstly we must get one thing firmly fixed in our minds that is the difference between ‘potential yield’ and what is being achieved or ‘actual yield’. The authors explain; Potential yields are the limit on what a wheat field can produce. This is determined by weather, soil type, the genetic potential of the best adapted wheat varieties and sustainable best practice. Farmers’ actual yields are further restricted by economic considerations, attitude to risk, knowledge and other socio-economic factors.
The authors claim due to worsening weather: ‘While wheat yields have been largely the same over the 26 years from 1990 to 2015, potential yields have declined by 27% since 1990, from 4.4 tonnes per hectare to 3.2 tonnes per hectare.’ Increases in carbon dioxide ameliorated those figures by some 4%, it is claimed.
The authors go on to add: Analysis of the weather data revealed that, on average, the amount of rain falling on growing crops declined by 2.8mm per season, or 28% over 26 years, while maximum daily temperatures increased by an average of 1.05℃.
Overall this means that wheat growers have improved their techniques during that time and they have held yields steady as the potential yield has decreased. The researchers go on to claim, based on weather observations from 50 stations around Australia that the changes in yield have not been uniform across the country. They found that in some areas the potential has not changed whereas in other places yield potential has declined by up to 100 kg/hectare each year, as shown on this map. What about this map? It explains a lot about WA and declining yields and shows how blessed South Australia is:
 The research has then looked at how close growers have been able to get their actual yield to the potential yield expressed as a percentage. I have put the words from the original article here in italics because there are interesting links which are well worth following. The authors then ask:
Why then have actual yields remained steady when yield potential has declined by 27%? Here it is important to understand the concept of yield gaps, the difference between potential yields and farmers’ actual yields.
An earlier study showed that between 1996 and 2010 Australia’s wheat growers achieved 49% of their yield potential – so there was a 51% “yield gap” between what the fields could potentially produce and what farmers actually harvested.
Averaged out over a number of seasons, Australia’s most productive farmers achieve about 80% of their yield potential. Globally, this is considered to be the ceiling for many crops.
Wheat farmers are closing the yield gap. From harvesting 38% of potential yields in 1990 this increased to 55% by 2015. This is why, despite the decrease in yield potential, actual yields have been stable. (emphasis added)
The article concludes with this horrifying prediction:
Let’s assume that the climate trend observed over the past 26 years continues at the same rate during the next 26 years, and that farmers continue to close the yield gap so that all farmers reach 80% of yield potential.
If this happens, we calculate that the national wheat yield will fall from the recent average of 1.74 tonnes per hectare to 1.55 tonnes per hectare in 2041. Such a future would be challenging for wheat producers, especially in more marginal areas with higher rates of decline in yield potential.
While total wheat production and therefore exports under this scenario will decrease, Australia can continue to contribute to future global food security through its agricultural research and development.
We are outwardly calm but inwardly bleeding to death.
Why 2041? Presumably because they have measured the last 23 years so they extrapolated out for another 23 years? Twenty three years is comfortably a long way off — so far off it that many of us will be driving that big red header in the sky by then and for the rest, thinking ahead 26 years can invoke an eye-rolling response — ‘2041 is a long way away, lets be calm and gentle with our response anything can happen in 23 years.’ ‘Let’s not panic, it’s only a prediction. Yes, yes I know it’s good science but 23 years, c’mon!’
To put 23 years into perspective we just have to ask ourselves what were we doing in 1995? The wool prices had crashed. Paul Keating was Prime Minister. Bill Hayden was GG. Harold Larwood of bodyline fame dies. US imposes sanctions against Iran (!). ‘Apollo 13′. “Braveheart’. Bill Clinton was President of America.
Many wheat growers should get out now.
The comforting thing is that in reality we don’t have 26 years, using the figures from this article alone, the wheat industry in most of Australia will be finished long before 2041. In fact, based on the evidence presented here and in my last article, there is a sound, I claim an irrefutable argument that wheat growers in the low yielding areas areas should be planning their exit from the industry starting right now. That is unless they know the fairy with the magic wand.
America and Australia among the great wheat producing nations are failing to increase wheat yields to feed the ever burgeoning world population and more importantly to keep their farmers heads above water and in many cases prosperous. What America has that Australia doesn’t have are subsidies. There are also alternative crops that American growers can turn to, something that hasn’t been developed in Australia. Australia and America are major wheat exporters and the question must be asked whether exports can be sustained at low yield, compared to other counties like Russia, Ukraine and Romania, where we are told there is still great opportunity for improvement in both yields and infrastructure efficiencies, which can only improve the comparative advantage they already enjoy being closer to major markets. This raises some interesting questions for the Australian wheat industry:
- Because it can be shown that yields are at best stagnant and have been for twenty years, has Australia reached the limit of its yield potential for wheat?
- For how long should, the average Australian wheat farmer, if they are sensible, continue to produce wheat at the current prices and at their current five year average yield?
- It also raises the question which can only be answered by plant breeders, as to whether, given our changing pattern in rainfall and their inability to produce new strains of wheat which perform better than the rate of inflation, can they now produce new strains of wheat which are going to raise the Australian industry out of the twenty year yield doldrums and if they can, what is it going to cost?
I wish the Global Farmer had the money to research the knowledge, values, attitudes and beliefs and so understand the behaviour of a statistically significant sample of Australian wheat farmers, their families and their advisers on:
- Farmer’s attitudes to the wheat industry in the twenty first century and their place in it.
- With yields static and probably declining and costs continuing to increase, what does the future hold for all wheat growers?
- Determine if there are those who are growing wheat because there is (they believe) nothing else they can do with the land?
- Find out if there are those who, because of debt, cannot afford to sell the farm because what would be left would be insufficient to retire on or start again somewhere else?
- Find out if there are families, especially wives or partners who are tired of the stress and strain of wheat farming, of borrowing big sums of money every year on a gamble on the weather. Are the rewards sufficient compensation for the stress and strain?
- If rural de-population continues, where will it finish and what effect will that have on those who are left, when the banks close, the shops close and so on?
- Find out if rumour is backed by fact and there are those who want to retire but wonder whether they can afford to; whether the sale of the farm will be sufficient to buy a house somewhere and retire on an income better that the old age pension?
- Determine if there are farmers who are ‘stuck’ on the farm because they cannot find a buyer at their price?
- Learn from who are still educating their children what they believe the future holds for them and those children?
- Talk to those wheat growers who are producing below 1.8 to 2.0 tonnes per hectare average and those who are producing above the average and compare their attitudes to a range of questions.
The wheat industry in Australia has the opportunity to determine its future rather than let it continue to evolve. It’s not a difficult equation, either yields must increase or costs decrease if the majority of wheat growers are to stay in business. The only agencies with the funds and the ability to plan for the future of the Australian wheat industry are the GRDC supported by Federal and State Governments.
Roger, thankyou for a well researched and well articulated article.
There are gaps in the article, and there are real solutions. Perhaps not with continuation of the centralised cronyism called research that has presided over this gigantic erosion of margins.
I look forward to an email from you to discuss.
Australia total Wheat production has been steadily increasing, along with farm cash income
http://www.agriculture.gov.au/abares/research-topics/surveys/grains
WA has just announced it second biggest harvest ever 17.2 million tonnes, and most valuable, with 2017 being the biggest recorded at 18 million tonnes.
https://thewest.com.au/business/agriculture/how-the-west-got-back-on-crop-for-bumper-65b-harvest-ng-b881067354z
There is no doubt that last harvest was a good one and the price of wheat was better than it has been for some time.
I saw crops from just north of Katanning to north of Geraldton, the likes of which I have never seen for fifty years. Wonderful crops.
The challenge is to alter the long term trend lines, because they are all going in the wrong direction and I believe I have put up the figures, not mine, the research from others that shows a decline in yield over time due to rainfall moving from NE to SW, the decline in the real value of wheat is a fact.
My father got out of cropping 20 years ago as he could see exactly what you are stating in this article. Whilst the crops over the last couple of years are fantastic what is the actual profit to the farmer after he takes his costs out to grow it as well as the money taken by graincorp or equivalent.
I find it diabolical that the very organisations that buy the wheat from then charge you back for processing it and getting it on the ships to export of which are making vast profits as they have very few costs and the farmer is made to pay for it.
This is a case of double dipping in my opinion and no wonder farmers are getting further into debt when you have parasites sucking the life out of the people who are producing the goods.