This discussion paper addresses a few of the changes, which have taken place in the eastern wheatbelt of Western Australia over last twenty years. Changes, which have brought us to where we are today, to where some are claiming there is a ‘Crisis in Agriculture’.
The question then becomes if there is a ‘crisis’ what has caused it?
The answer seems to be that it is self-inflicted injury.
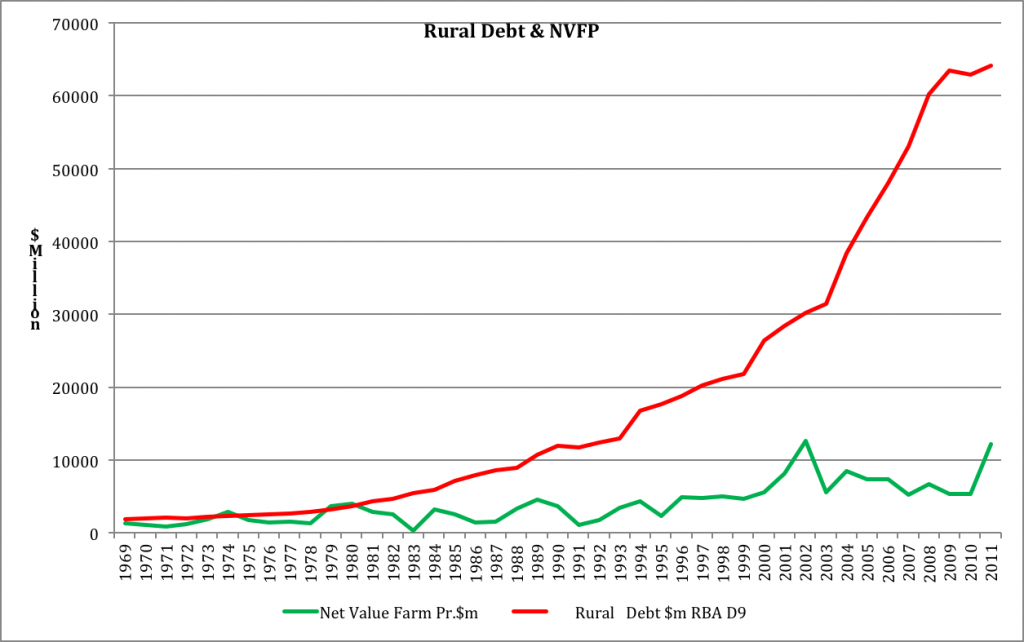
Chart 1. National Rural Debt & Net Value of Farm Production.
Compiled from: NVFP, ABARES 2012, Commodity Statistics, Rural Debt , RBA online, Table D9
(Ben Rees; B. Econ . M. Litt (econ) Reconstruct or Rationalize Agriculture?)
The graph in Chart 1 illustrates the trends, which have led to the current rural debt situation in Australia. Net value of farm production going nowhere, a bumpy ride for 42 years; while rural debt has gone from just under $2 billion to well over $60 billion during the same period.
The banking system was deregulated in 1986; note the divergence between the red and green lines in both charts, before and after. So was deregulation to blame for the spiral in rural debt or did we just overvalue ourselves?
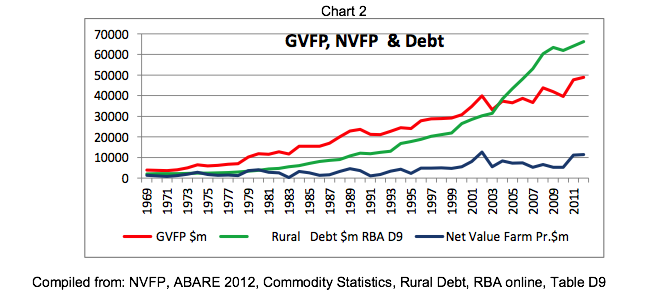
(Chart: Ben Rees; B. Econ . M. Litt (econ)Reconstruct or Rationalize Agriculture?)
Look at Chart 1 and Chart 2 together and you don’t need to be a graduate of the London School of Economics to see why we have a debt problem.
Spend more than a dollar to make a dollar and you have a problem, do that four years out of five and you have faith – and that’s all.
So what happened?
In 1970 there were 180 million sheep in Australia and the bottom had fallen out of the wool market. In the mid sixties to 1970 Australia planted a bit over 8 million hectares to wheat and the rural debt was just over $2 billion.
Western Australia was approving and clearing about 400,000 hectares a year ( The famous1 million acres a year!)
Clover pastures and sheep, followed by cereals was the rotation practised by most farmers.
It was becoming necessary to reduce tillage due to ever increasing soil erosion.
Minimum Tillage or Direct drilling was introduced mid 70s and was adopted in earnest in the late seventies and early eighties with the use of Spray-Seed and a massive investment by ICI Australia in agronomy extension.
Tillage reduction encouraged farmers to tighten rotations resulting in more cereals being planted. Hoegrass ® was introduced, ryegrass was controlled and the area planted cereals increased year on year.
By the mid eighties over 70% of all farmers were practising some form of what has now developed into No-Till. Yet in reality, little has changed in the practise, the major change has been in the chemical used for total weed control.
Figure 1. 1301.0 – Year Book Australia, 2006
Figure 1. This graph shows the real value of wheat going back to 1914. It has not been updated as far as I can determine since 2004. Given how costs have increased and in spite of the few years we have had with a high Australian dollar I am fairly certain the real value of wheat has continued to trend down. There is a graph on the same subject in US dollars and, not surprisingly, it is the same as the one above.
What the graph shows is that in 1971 based on 2004 values, wheat was the equivalent of $500/tonne and in 1951 reached the heady price of $1200 tonne.
By 1992 there were 142 million sheep in Australia and we planted about 14 million hectares of wheat. Rural debt had climbed to $12.4 billion. The real price of wheat was about $200 tonne.
By 2002 the sheep flock had shrunk to 102 million and the wheat crop was about 12 million hectares and the rural debt had grown to $30 billion and the real price of wheat was about $230 tonne. Dropping back to just over $200 tonne by 2004.
By 2012-13 this area planted to wheat had grown again to nearly 14 million hectares and there were about 77 million sheep in the country and the rural debt had grown to $66.2 billion.
So what we have to consider in the period from 1992 to 2012, sheep numbers have declined and the area cropped to wheat has increased. In that same period the rural debt has increased from $12.4 billion to $66.2 billion and the real value of wheat has fluctuated between $200 and $300 tonne.
It’s worth remembering that Australia currently grows only ~5% of the world’s wheat. We contribute, depending on the season, between 12% and 15% of the wheat traded annually. So we are not a big player globally, we are relatively important in the world wheat trade, but others could easily replace us as they progressively get their act together.
If the rest of the world (ROW) continues to increase yields and our yields continue to decline, we will become less important as a wheat grower on the global stage. (This is well illustrated in the graph in figure 6 )
Our national population is less than twice that of Metropolitan London or two reasonable sized towns in China. So in reality, as the world population climbs to 9 billion by 2050, the ROW, in the scheme of things, would have little trouble in feeding us.
Supply and Demand
At school, most of us learn the theory of supply and demand. Later in life, one way or another, we experience it. Sometimes we benefit from the experience, sometimes we don’t.
An understanding of the theory and the practical application of supply and demand is fundamental to the profitable running of any business, including farming.
We all know if there is a demand for something in a marketplace, the price of that ‘thing’ is determined by supply. If only a few ‘things’ are available in a market and the demand is high, the price goes up. The opposite happens if too many ‘things’ are available for that market, the price goes down.
If we apply the law of supply and demand to what has become known in the eastern wheatbelt of Western Australia as the ‘Crisis in Agriculture’, what do we find?
To determine if the theory of supply and demand is applicable to the economics of the eastern wheat belt, one source we have available to us are the statistics diligently compiled by ABARES. The values I use for grain prices and yields are not accurate to the last dollar, because the ABARES graphs have thick lines. But they are sufficient for the purpose.
Let’s go back twenty years or so to 1992, coincidentally 20 years after the launch of Bankcard — plastic money. Banks mailed Bankcards to those customers who they believed were suitable for a $300 credit risk. Within 18 months 1 million Bankcards had been issued. That meant that if all cardholders took up their maximum credit, which they didn’t, the total Bankcard debt would have been $300 million.
In 2013, nearly 8 million credit card users owe $36 billion and growing. The average debt is $4757. Every Cardholder will pay an average of $800 in interest over the next 12 months.
So how did we get a debt of over $60 billion with no profit? That’s a lot of money.
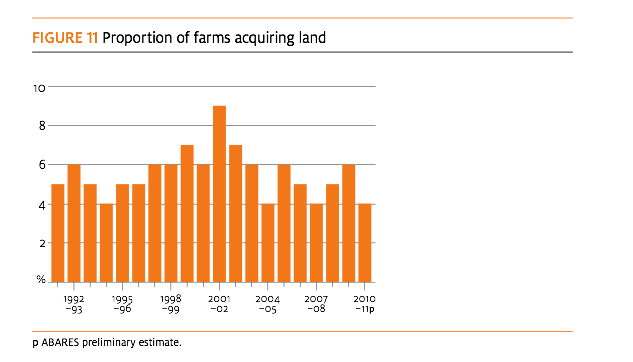
As far as I can determine there is no way of being absolutely sure, but in Figure 2, if you add up each years percentage, more than 100% of all farms bought land over the last twenty years or so. What one can assume with certainty is that all land which came on to the market was sold, and, most importantly was bought by farmers, and, quiet clearly as Figure 3 shows, prices increased year on year.
So is land purchase – the supply and demand for land by farmers, the root of all evil when it comes to determining why agriculture has a debt of over $60 billion? The figures do not include some of the outrageous prices, which have recently been quoted for land purchased by overseas interests
Figure 2. This graph was sourced from ABARES Farm performance: broadacre and dairy farms, 2009–10 to 2011–12 and shows national figures as (Figure 11)
In 1992, farmers now in their sixties were in their forties. And those now in their forties were in their twenties. So mature and capable of sensible analysis.
There are those who complain that the banks have been the problem. That since Australia joined the modern world and deregulated the banks, discarded our fiscal short trousers as it were; the world has never been the same.
There are only a few answers to those claims. The first is the banks are in business to lend money – that’s what they do – they do it very efficiently – make huge profits and keep their shareholders happy. The banks of today, whether we like it or not, are not the banks of our youth.
I bemoan the passing of carburetors, distributors and spark plugs, mainly because I can’t fix things that go wrong with the car. I have to employ someone to do it and they charge an exorbitant amount, which I am sure is the electronic equivalent of setting the gap on the points and fiddling with the mixture on the carby- but they have the ‘black box’ and I don’t. Lift the bonnet on a modern car and all I can say is ‘Houston, we have a problem.’
Figure 3. This graph was sourced from ABARES Farm performance: broadacre and dairy farms, 2009–10 to 2011–12 and shows national figures. (Figure13)
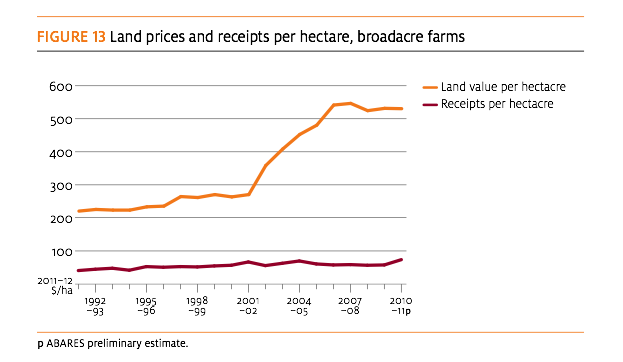
This graph, Figure 3, shows quite clearly the massive increase in national land values between 1992 and 2010 and no increase in receipts per hectare during the same period. There should be another line showing input costs!
Secondly, if you buy something you can’t afford, whom do you blame, the person who sold it to you or the voice in your ear saying, ‘go on – buy it!’ Buyer’s remorse, nothing worse except the realisation that you can’t make yourself pregnant.
Blaming the banks for having too much money just means you have been seduced by an organisation that has so much money it chains down the pens at the counter.
Trends in land values determined by land sale records.
The land values I have used in this article are compiled from Landgate 2012 statistics.
In the Shire of Merredin in 1992 land was changing hands at $180 per hectare.
In the same year, ABARES showed that the average yield in the eastern wheat belt for all grains was about 1.3 tonnes per hectare. The average price received for grain was about $230 per tonne, which made the gross income per hectare, $300. So it took about 0.8 of a tonne of grain to pay for one hectare of land in the Merredin Shire in 1992.
The average farm business profit in the eastern wheat belt that year, according to ABARES, was about $50,000, or enough to buy 277 hectares in the Shire of Merredin.
In Bruce Rock in the same year, 1992, land was changing hands at $240 per hectare. The statistics do not differentiate between Shires. So assuming the same yield and price for grain, to purchase a hectare of land in Bruce Rock in 1992 required 1.04 tonnes of grain, 43 kg more than the average yield or $10 more than the gross income per hectare.
Ten years later, by 2002 land was changing hands in the Merredin Shire for $450 per hectare. In the same year ABARES shows the average yield was between 0.8 and 0.9 of a tonne per hectare. The average price of grain in that year was a bit over $300 per tonne. So gross income from 0.8 tonnes per hectare was $240. The difference between the cost of a hectare of land and the gross income from that land was minus $210. In other words you needed another $210 to buy a hectare.
The next year 2003/4 and 2004/5 the price of grain dropped to $200 per tonne and the average yield was about 1.4 of a tonne. Again according to ABARES for the specialist grain farmer profit that year was at break even and for the mixed enterprise there was a loss of about $50,000.
In 2006/7 and 2008/9 the price of grain again rose to $300 per tonne. The average yield was about 1.3 tonnes per hectare, which generated a gross income per hectare of $390.
In the same year, 2008/9, land changed hands in the Merredin Shire for $900 per hectare. So a hectare of land cost 2.3 times the gross income from that hectare in that year.
In 2012 in the Shire of Merredin land values have fallen back to $800 per hectare. In 12 months this is a decrease of 5.9%.
The story is different for Bruce Rock. By 2002 land was changing hands at $600 per hectare. The average yield for the eastern wheatbelt, as we have already learned, was between 0.8 and 0.9 tonnes per hectare and the average price of grain was $300 per tonne, making the gross income from one hectare of $240.
So a hectare of land in the Shire of Bruce Rock in 2002 cost $360 more than the gross income from that land in that year.
By 2006, just four years later land was changing hands in Bruce Rock for $1050 per hectare. Even with grain at around $300 per tonne it would have taken over three tonnes of the gross value of grain to pay for one hectare of land. At an average yield of 1.4 tonnes per hectare and that’s being generous based on history, it would take the gross income of 2.5 years at $300 tonne to pay for that land.
Comparing Specialist Grain Farms to Mixed Enterprise Grain Farms.
For the eastern wheatbelt ABARES splits farm businesses into two groups: specialist grain farms and mixed enterprise grain farms.
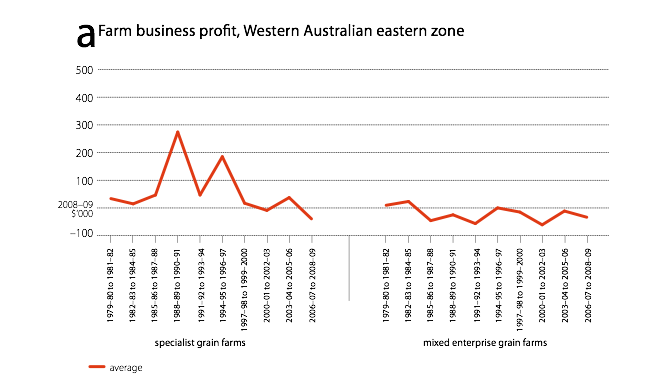
According to ABARES the best years for profit for the specialist grain farms was 1988/89 to 1990/91 when average profits were $280,000 to $300,000. After that its been a bumpy ride to say the least with the period 2006 to 2009 falling below the line, that is making a loss.
Since 1984/5 for the mixed enterprise grain farms the average annual profit has varied between break even and negative to the tune of around $50,000 a year.
So even being generous, specialist grain farms after the late 80s and early 90s were struggling and the mixed enterprise farms consistently just broke even or made a loss.
This is where we get a paradox. In 1992 the rural debt in Australia was $12.4 billion. In 2002 it was $30.2 billion. By 2012 the year of ‘crisis’ the debt had grown to $66.2 billion.
Between about 1980 and 2011, the number of farmers in Australia declined by 40%. Those farmers sold their land – other farmers bought it.
Land prices, so farm values, have doubled every ten years.
Three thousand hectares in Merredin in 1992 was notionally worth $540,000. By 2002 it was worth $1.35 million and by 2009 that value had grown to $2.7 million.
For Bruce Rock the values for 3000 hectares are: 1992 $720,000: 2002 $1.8 million and in 2006 an amazing $3.15 million. Land sales in Bruce Rock have now fallen to $950 a hectare or a drop of 9.5%.
What is mystifying is how farmers and more as importantly their advisers were able to justify to themselves and to their financiers, the banks, presumably with budgets and all they entail, the vast amounts of money they needed to purchase ‘things’, principally, more land and machinery.
One look at Figure 4 (chart a) from ABARES shows that life after 1997 for the average specialist grain farmer and for the mixed enterprise grain farmer after 1984, was getting a bit untidy to say the least.
Figure 4. This graph was sourced from ABARES publication: Physical and financial performance benchmarks for grain producing farms, Western Australian eastern agroecological zone. 2011.
Graph ABARES
What is unequivocally evident from the Reserve Bank records is that the trading banks, over twenty years or more, did willingly; lend ever-increasing, vast sums of money to farmers.
And in that process the banks, presumably, convinced themselves that the apparent increase(s) in the value of the borrowers land was a real and tangible asset. That is, should the borrower default, the asset would ‘cover’ the loan.
The question then becomes, whether or even how the lender and the borrower considered the ample evidence accumulated over the 20 years (of their experience) that grain prices were erratic and decreasing in real value year on year and that input costs were inexorably increasing year by year, and in the light of that evidence how did they explain land ‘values’, which were doubling every ten years and how did they satisfy themselves, based on those figures, that the borrower was able to service the debt?
Both parties also must have ignored the evidence that wheat yields throughout Western Australia and Australia have been declining for at least the last eight years or so.
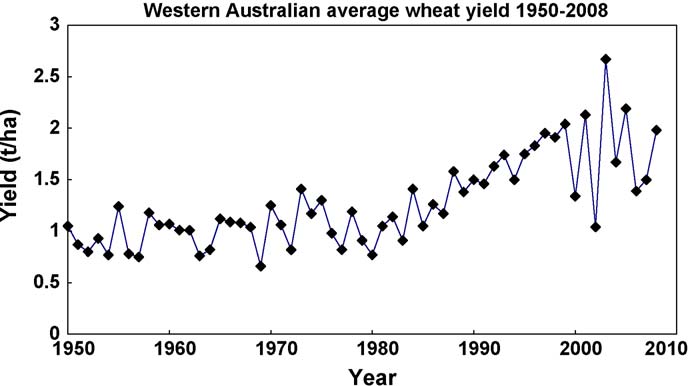
Figure 5. Average yield of wheat in Western Australia 1950–2007. Data from Co- operative Bulk Handling Ltd. Dr Wal Anderson.
Figure 6. Trends in Australian and global wheat yields per hectare since 1980. The Australian trend lines are from 5 year moving means with and without drought. The light blue line shows global annual average yields per hectare, while the magenta line shows the calculated (straight) line trend for those yields.
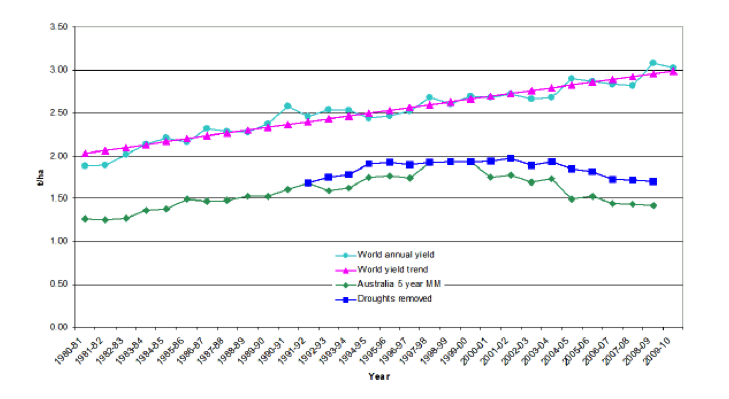
Source Figure 6 : Australia’s declining crop yield trends I: Donald revisited. Andrew Lake, Pristine Forage Technologies.
The Law of Supply and Demand came into play when the land market became over supplied — land values declined — asset values dropped — debt to equity ratios went into free fall and the lenders, the banks, went into damage control.
So why have we got a ‘Crisis’ in the eastern wheatbelt of Western Australia?
It looks very much like there were plenty of willing land sellers, there was competition from prospective buyers and that pushed land values up, and there were plenty of willing lenders, at times competing with each other to lend money. There was no historical data nor future indications that the debt could ever be repaid, never mind within a reasonable time. So the question remains why did the farmers borrow? Were they seduced by the propaganda that there were economies in scale. Why did the banks lend? They have to answer that question.
What is evident, like the sub-prime mortgage scandal in the United States, the whole thing is a mess.
For some, the harvest 20013/14 will be the best for many years. For some it will just be an average year and for some it will add another year to the ‘crisis’. For some there will be an opportunity to reduce debt, for others that opportunity will be minimal and for some non-existent.
Common to all will be a reduction in land values. At budget time this will once again bring into play calculations on debt to equity and there are early indications that serious discussions will take place between the lender and the borrower regarding the ‘ability to repay’ within a specified period and demands by the lender for agreement on the consequences for the borrower if agreements are broken and debts not met as and when they fall due.
One swallow does not a summer make. This harvest has been the saviour for many, now it has to be repeated over and over in the years to come and that is asking a lot of the swallows. For those for whom it hasn’t been a saviour, the challenge continues.
This article has concentrated on the eastern wheatbelt of Western Australia. What is the story in the other regions?
Further reading: http://www.grdc.com.au/Research-and-Development/GRDC-Update-Papers/2013/02/Global-and-commercial-realities-facing-Australian-grain-growers
Jusst giving it a try Roger, a mess that really needs fixing…rw
Very detailed report – Thank you.